Where it’s wettest
Item Information
Title:
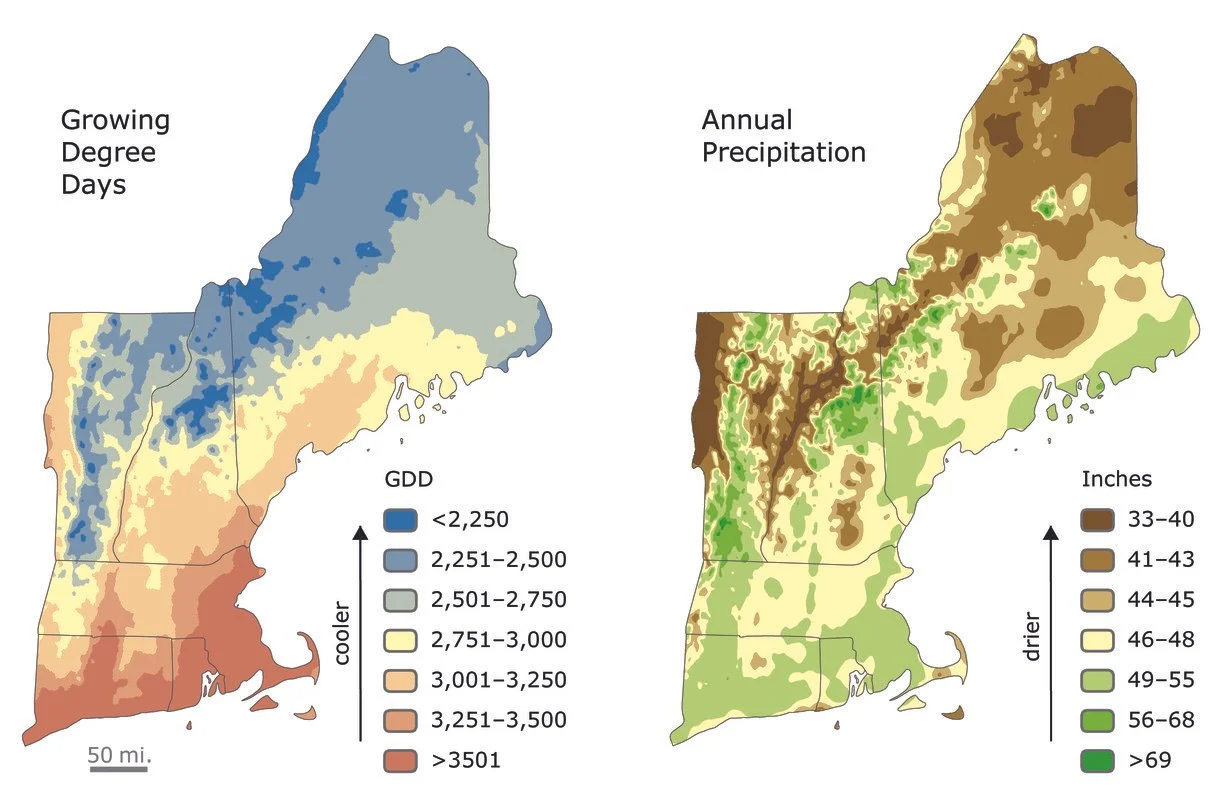
New England Climate Graph
Description:
2-10 Although precipitation and temperature (shown as growing degree days, a measure of total warmth over the year) broadly decline to the north in New England, those patterns are strongly modified by elevation.
Name on Item:
Brian R. Hall [Compiler]
Date:
February 26, 2016
Format:
Genre:
Location:
Harvard University
Harvard Forest Archives
Collection (local):
Harvard Forest Martha's Vineyard Collection
Subjects:
Coastal
Regional Studies
Climate
Places:
New England (area)
Permalink:
https://ark.digitalcommonwealth.org/ark:/50959/vh53xs759
Terms of Use:
Copyright (c) Brian R. Hall
This work is licensed for use under a Creative Commons Attribution Non-Commercial No Derivatives License (CC BY-NC-ND).